How Does Arctic Sea Ice Change at Different Spatiotemporal Scales?
In recent years, the warming rate of the Arctic has been 2-4 times that of the global average, which has had a significant impact on climate change in the Northern Hemisphere. However, the physical mechanisms of Arctic sea ice changes remain unclear, and existing models still have significant biases in predicting the results of Arctic sea ice changes.
Recently, the research team led by Prof. HUANG Haijun from the Institute of Oceanology of the Chinese Academy of Sciences (IOCAS) has revealed the mechanism of Arctic sea ice changes at different spatiotemporal scales through the analysis of satellite and reanalysis data.
The study was published in Journal of Climate on Jun. 29.
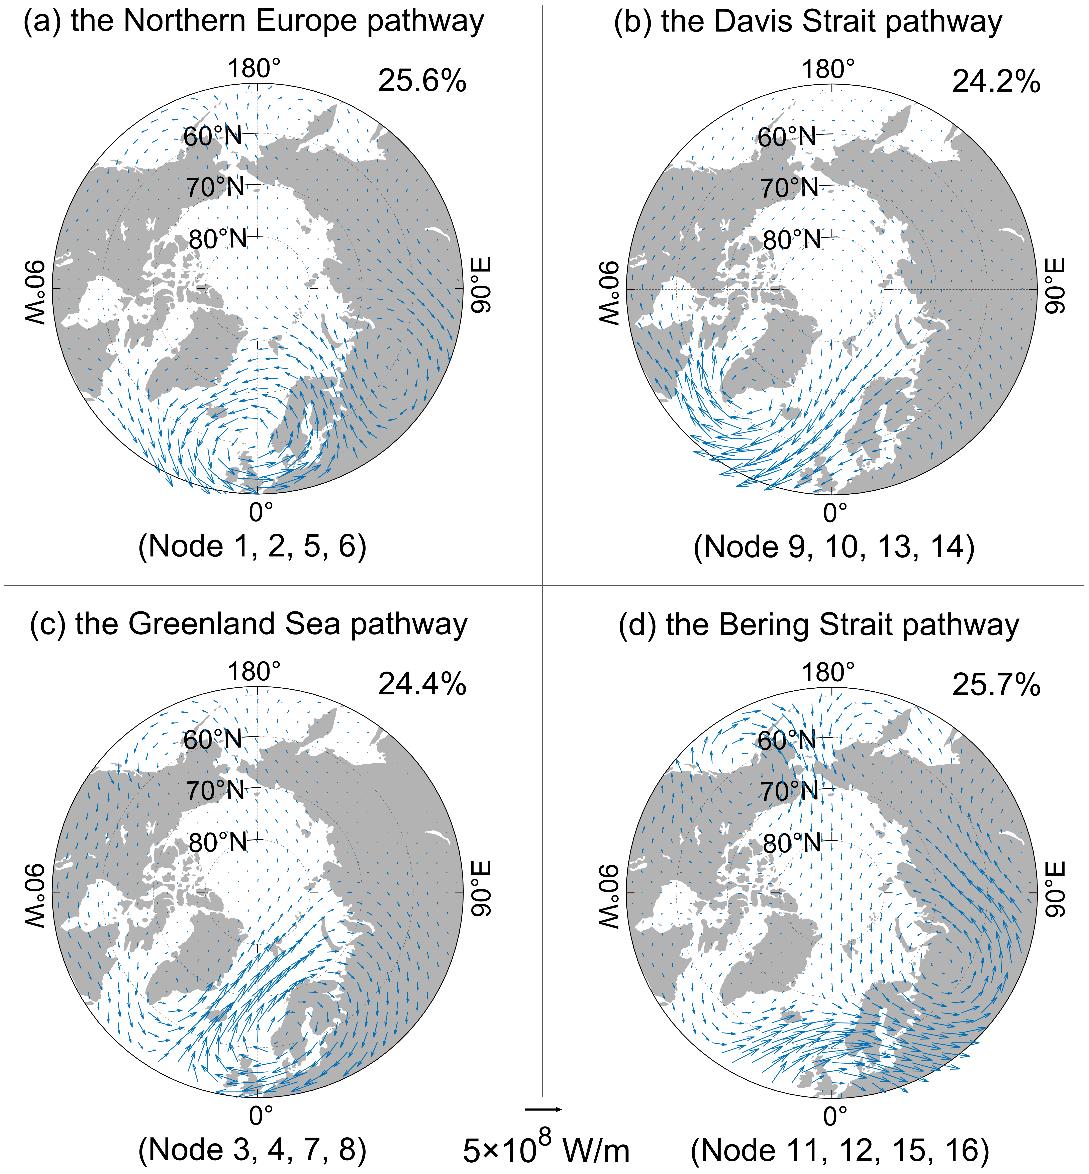
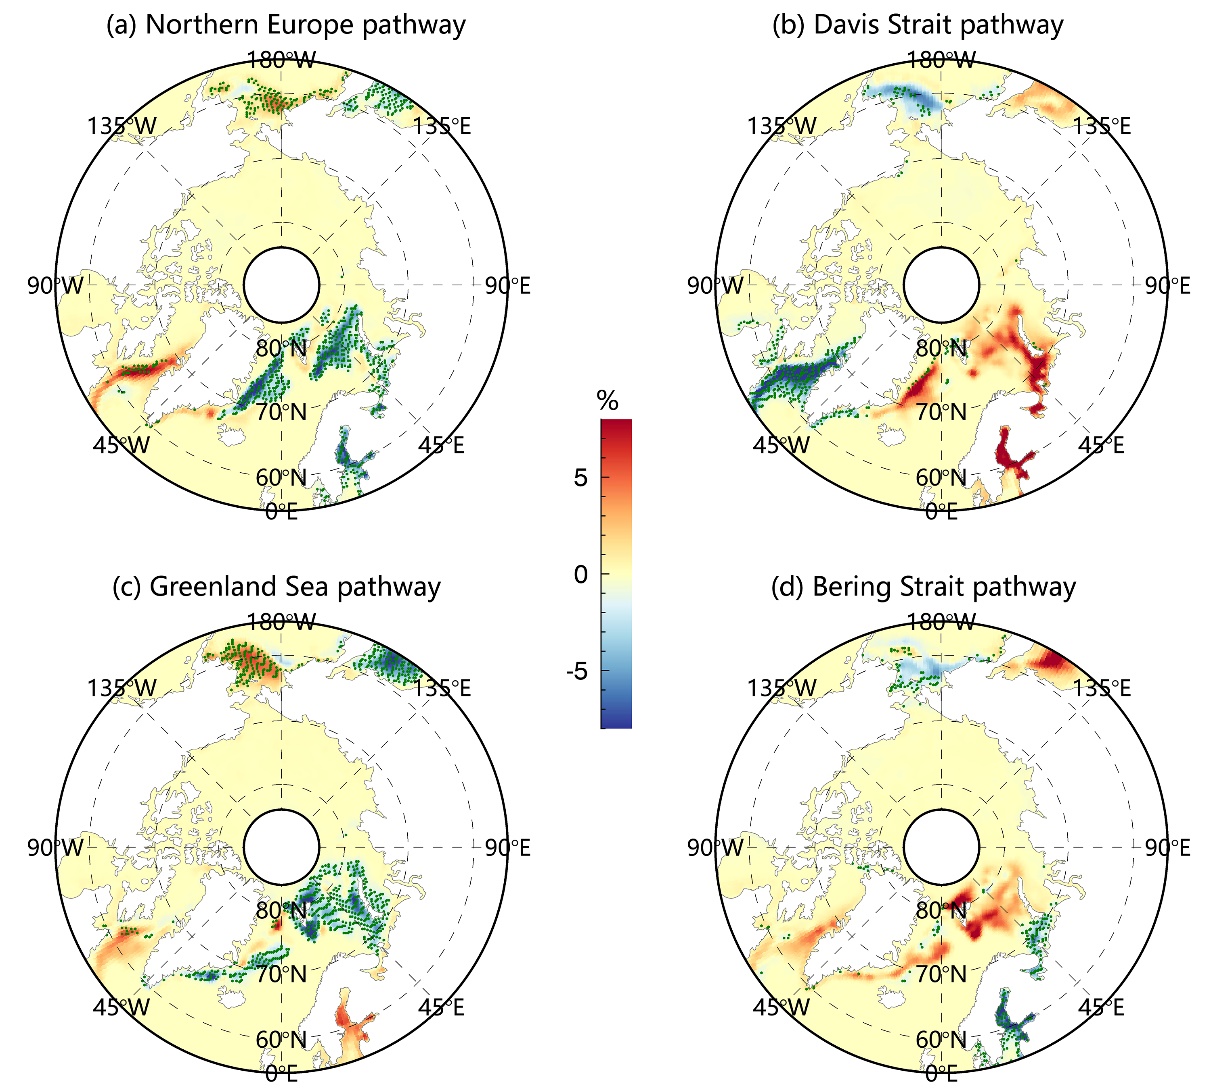
Researchers attempted to obtain the spatial distribution of Arctic water vapor transport from a synoptic scale using Self-Organizing Maps (SOM) clustering technology, elucidated the four key channels for mid latitude water vapor entering the Arctic channel, and further revealed the response process and specific physical mechanisms of Arctic sea ice to water vapor changes. It is found that cyclones will enhance the process of water vapor transport and convergence, which will lead to the increase of downward long wave radiation and turbulent heat flux, which can lead to the significant reduction of sea ice extent in different sea areas in winter.
"Through thermodynamic analysis, we believe that the harmful effects of poleward latent energy transport on Arctic sea ice are largely due to the enhanced local atmospheric ice interaction, which increases downward longwave radiation and turbulent flux, leading to surface warming and promoting sea ice loss," said LIANG Yu, first author of the study.
"This study lays the foundation for a deeper understanding of the interaction mechanism of atmosphere sea ice ocean in the Arctic region,”said Dr. BI Haibo, corresponding author of the study.

Fig. 1 The four primary pathways: (a) the Northern Europe, (b) the Davis Strait (c) the Greenland Sea, and (d) the Bering Strait pathways.

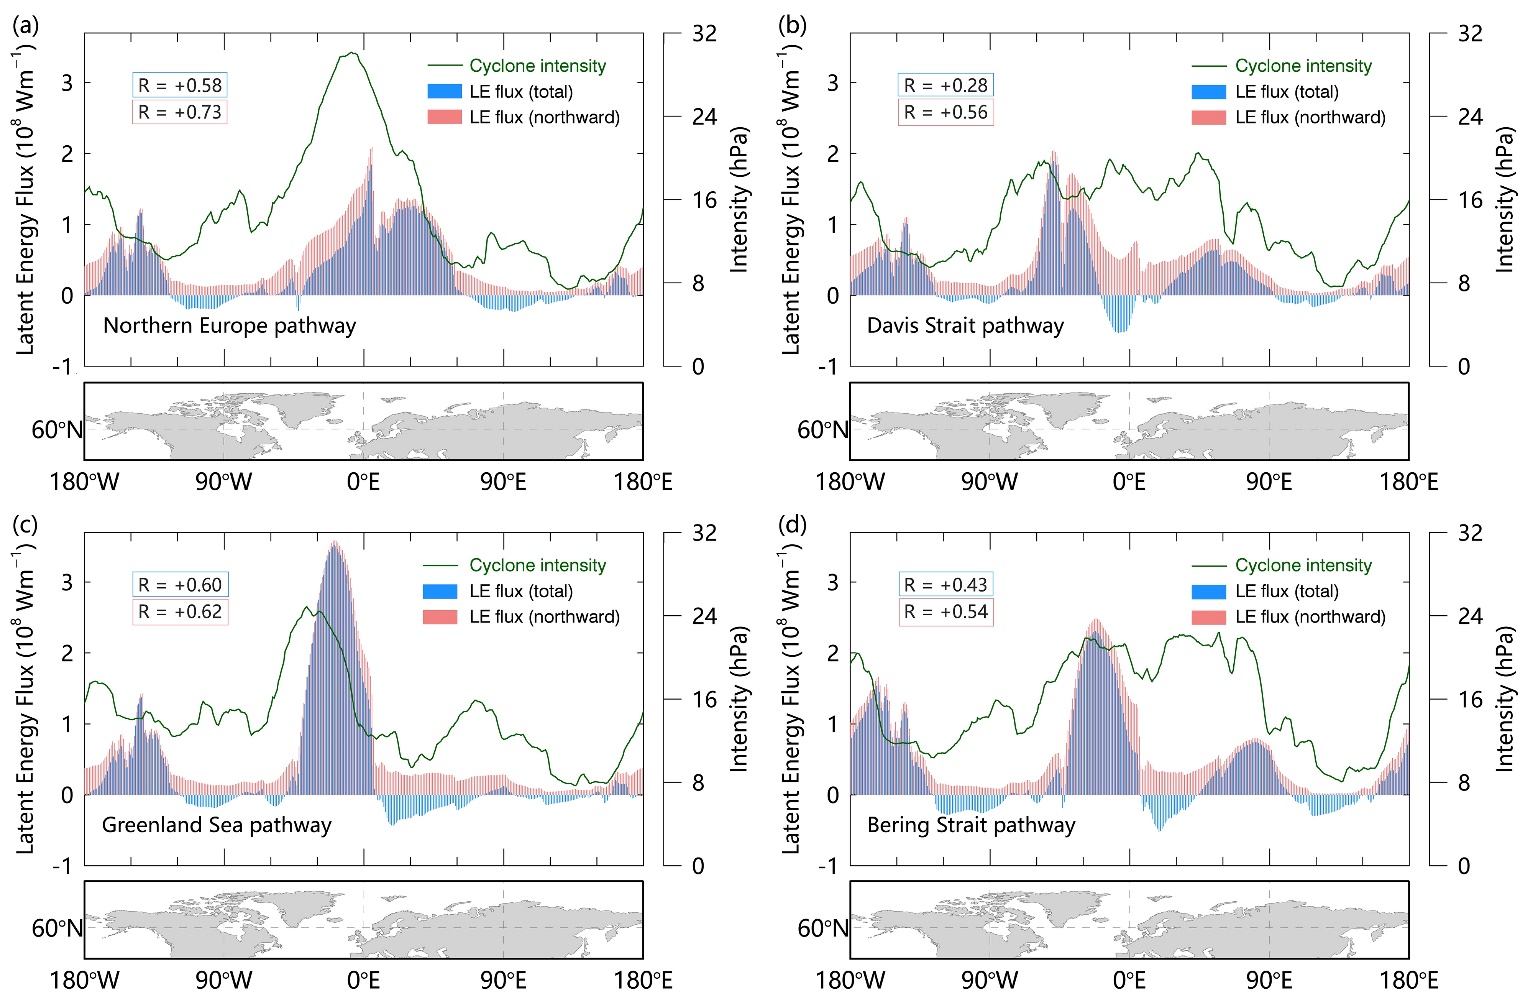
Fig. 2 Longitudinal distributions of the climatological vertically integrated latent energy flux in the meridional direction across 60° N, as well as the intensity of cyclones at 60° N, averaged over the winter months (January-March) during 1979-2021.

Fig. 3 Anomalies of the SIC regulated by various latent energy (LE) transport pathways during the winter months (January-March).
LIANG Y, BI H, LEI R, et al. (2023). Atmospheric latent energy transport pathways into the Arctic and their connections to sea ice loss during winter over the observational period. Journal of Climate.
(Text by BI Haibo & LIANG Yu)
Media Contact:
ZHANG Yiyi
Institute of Oceanology
E-mail: zhangyiyi@qdio.ac.cn
(Editor: ZHANG Yiyi)