Seasonality of the Kuroshio Intensity East of Taiwan Modulated by Mesoscale Eddies
The intensity of Kuroshio Current east of Taiwan shows a clear seasonality, and the Kuroshio Current is strongly affected by mesoscale eddies from the subtropical countercurrent (STCC) region, but the contribution of eddies to the seasonality of the Kuroshio is not clear. Using the sea surface geostrophic velocity and mesoscale eddies derived from satellite altimeter data and the geostrophic velocity calculated from gridded Argo-only data, the mesoscale eddies that arrived in the area east of Taiwan, as well as the contributions of the eddies to the seasonal variability of the Kuroshio intensity in the East Taiwan Channel (ETC) were studied.
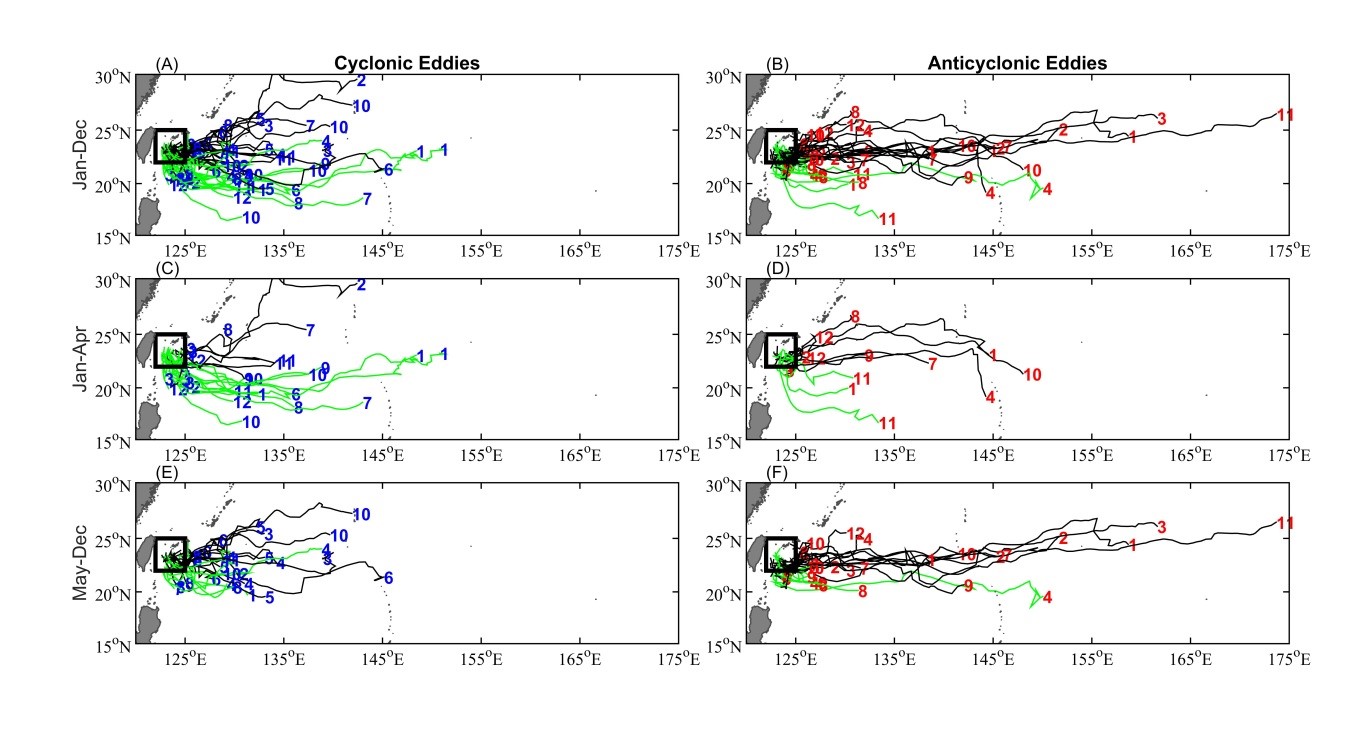
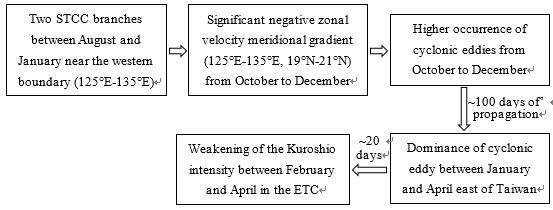
In the STCC region, the good correspondence between the eddy polarity and zonal velocity meridional gradient indicated that the background circulation played an important role in determining the eddy polarity. Near the western boundary (125°E-135°E), the zonal velocity indicated that there were two STCC branches with a remarkable westward current between August and January. These currents resulted in a significant negative meridional gradient of zonal velocity between19°N and 21°N from October to December. Since the low-PV water was stacked on the northern side of the STCC, the eddy generation favored the cyclonic eddy. Hence, this significant negative meridional gradient of the zonal velocity during this time led to a higher occurrence of cyclonic eddies than during other months. Because the mean duration for an eddy from this region to reach the area east of Taiwan was ~100 days, the arrival of the cyclonic eddies occurred between January and April, which explains the dominance of cyclonic eddies in the area east of Taiwan between those months. In addition, the eddies took ~20 days to arrive in the ETC after they entered the study area, which caused a weakening of the Kuroshio intensity between February and April in the ETC.

Figure 1.Trajectories of SSH-based cyclonic (left) and anticyclonic (right) eddies arriving in the area east of Taiwan between January and December (A, B), between January and April (C, D) and between May and December (E, F). The black rectangle represents the area selected to count the eddies arriving in the area east of Taiwan.The black (green) lines represent the eddy trajectories that originated from the eastern (southern) boundary of the area. The numbers denote the position and month when the eddy was first detected.

Figure 2. Schematic plot of the impact of eddies on the Kuroshio intensity seasonality.
Citation: Yin Yuqi#*, Lin Xiaopei, Hou Yijun (2019), Seasonality of the Kuroshio Intensity East of Taiwan Modulated by Mesoscale Eddies, Journal of Marine Systems, 193, 84-93. SCI